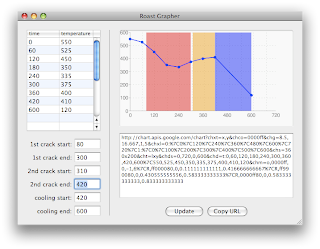
Now with just a few seconds of data entry I have a graph of temperature against time, along with the phases of the roast (red for first crack, orange for second crack, blue for cooling).
I'll see how this works out and modify it accordingly. I think I might have it generate a table with the data as well.


No comments:
Post a Comment